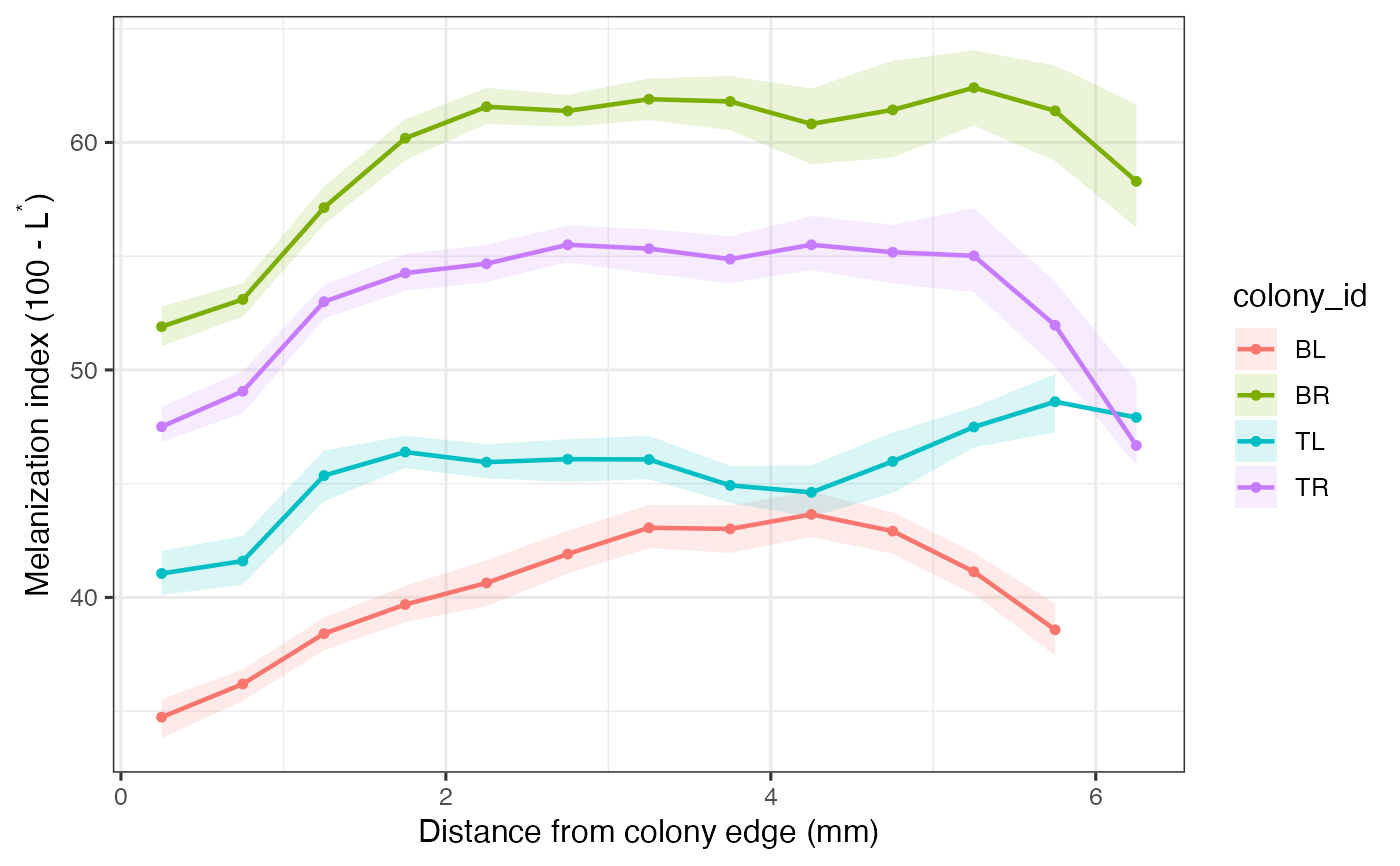
Plot edge-to-centre melanization profiles
plot_profiles(x, colour_by = "colony_id", facet_by = NULL)Arguments
- x
A
mycohalo_result, or a profile data frame (e.g.out$profilesfromanalyze_plates()).- colour_by
Column used for colour (default
colony_id).- facet_by
Optional column for facets (e.g.
plate_id, treatment).
Value
A ggplot object (requires ggplot2).
Examples
sim <- simulate_plate(width = 300, height = 400, seed = 12, edge_lightening = 10)
res <- analyze_plate(sim$image, verbose = FALSE)
if (requireNamespace("ggplot2", quietly = TRUE)) plot_profiles(res)
#> Warning: Removed 1 row containing missing values or values outside the scale range
#> (`geom_ribbon()`).