
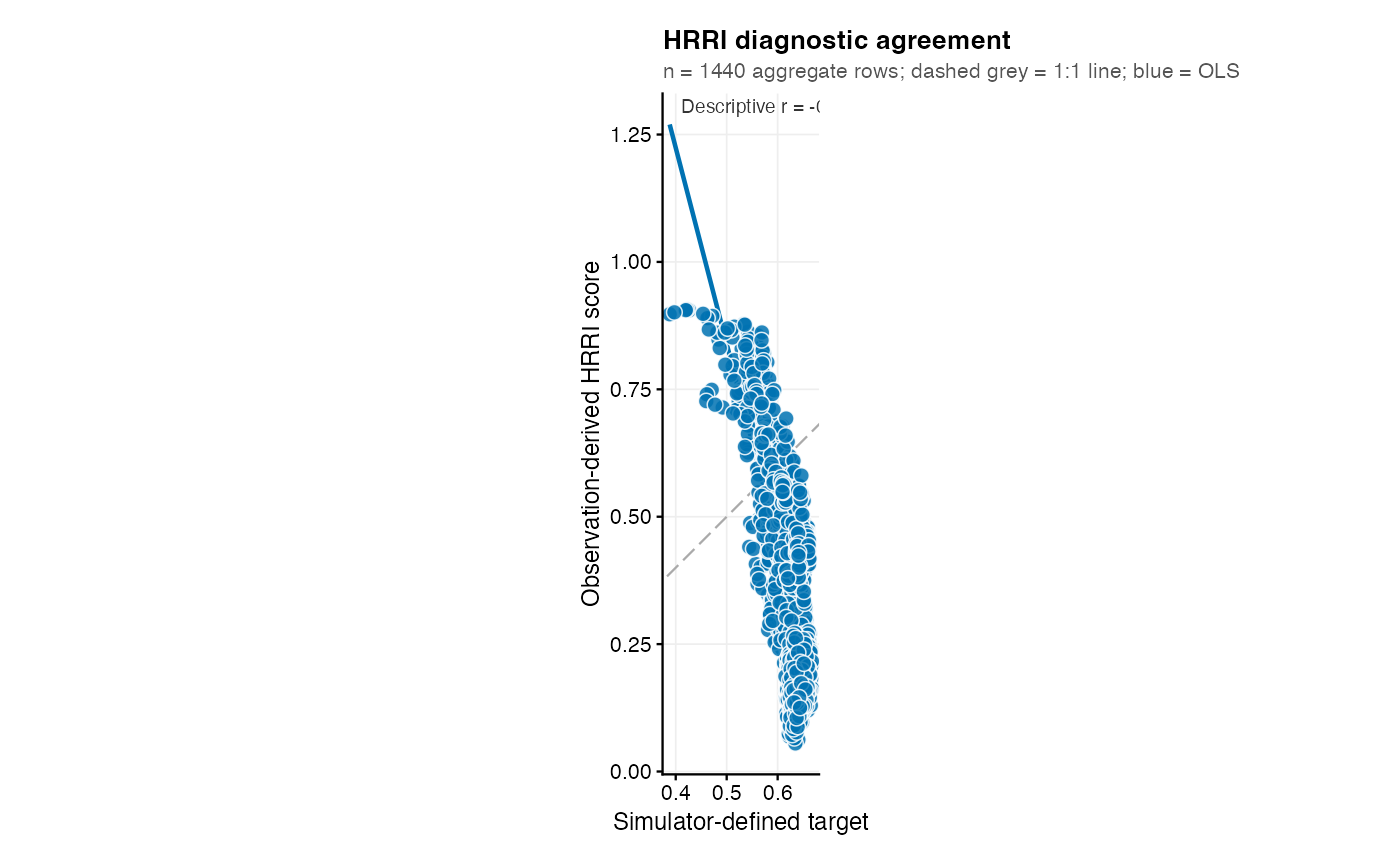
Scatter of HRRI score against a simulator-defined target
Source:R/plot_rri_validation.R
plot_rri_validation.RdPlots mean RRI versus a declared synthetic target per aggregate row, annotated with descriptive Pearson r and direct score-target RMSE, not LOO error. No model is trained or held out by this plotting function.
Usage
plot_rri_validation(
  pool_agg,
  rri_col = "RRI",
  truth_col = "truth",
  colour_col = NULL,
  label_col = NULL,
  base_size = 9
)
Arguments
- pool_agg
Seed-level aggregate data frame with columns
RRIandtruth(one row per seed).- rri_col
Name of the HRRI column in pool_agg (default "RRI").
- truth_col
Name of the latent truth column (default "truth").
- colour_col
Optional column for point colour (e.g., "n_cycles").
- label_col
Optional column for point labels.
- base_size
Base font size.
Examples
# \donttest{
sim <- simulate_redox_holobiont(seed = 1)
res <- rri_pipeline(soil = sim$Eh_stability, plant = sim$ROS_flux)
#> Warning: Unanchored latent axes have arbitrary signs; RRI is exploratory, not directionally validated resilience.
#> Warning: Excluding simulator-derived hidden columns from scoring: Cacc_EAC, Cacc_EDC, Cacc_total, Cacc_fraction, net_oxidative_balance, alpha_accept, alpha_donate, k_accept_h, k_donate_h
agg <- data.frame(RRI = res$row_scores$RRI, truth = sim$latent_truth)
plot_rri_validation(agg)
 # }
# }