
Draw the reproducible simulation demonstration
Source:R/rri_simulation_demo.R
plot_rri_simulation_demo.RdDraw the reproducible simulation demonstration
Usage
plot_rri_simulation_demo(
  demo,
  figure = c("observations", "coverage", "capacity")
)Value
Invisibly returns the plotted data table; draws on the active device. Uses base graphics, so no optional plotting package is required.
Examples
# \donttest{
demo <- rri_simulation_demo(seed = 20260830L)
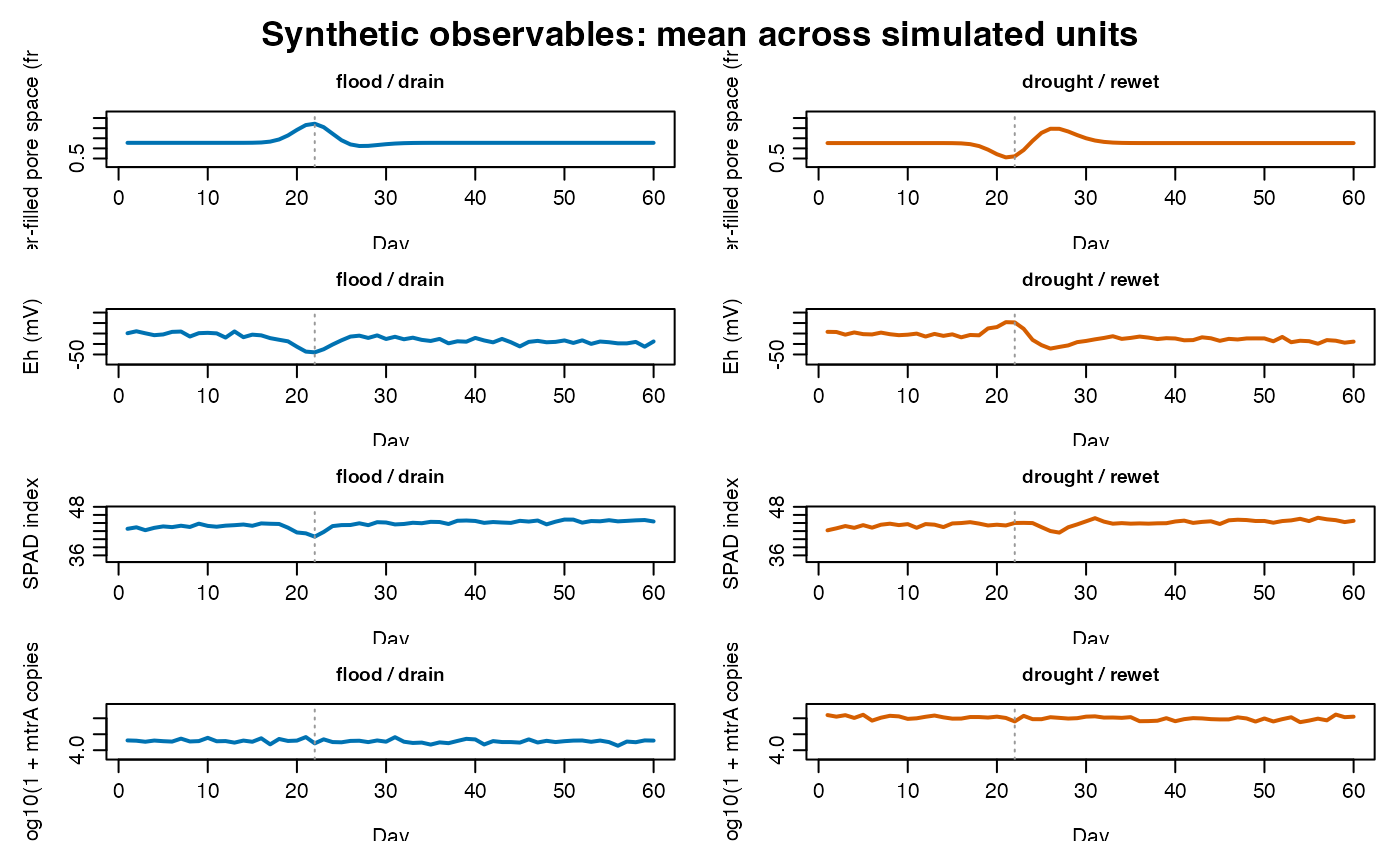
plot_rri_simulation_demo(demo, figure = "observations")
 # }
# }