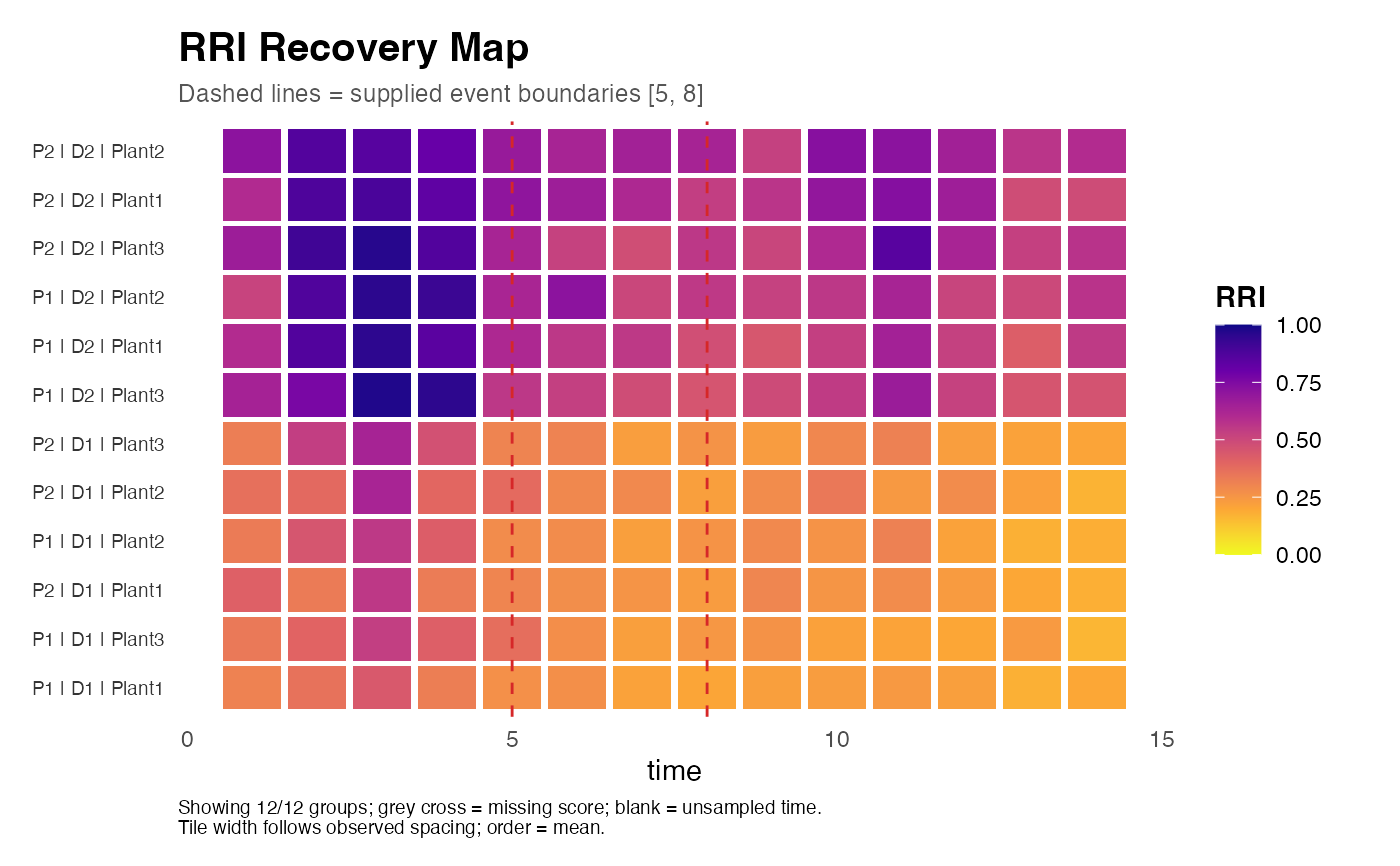
Visualises per-group RRI trajectories through baseline, perturbation and recovery phases as an observation tile map. Each row is one trajectory group; time proceeds along the x-axis; tile fill encodes RRI magnitude; vertical bands mark the perturbation window; and trajectory class is annotated on the right margin.
landscape shows cross-metric comparison per trajectory, while the recovery map shows temporal RRI dynamics per group.
Arguments
- res
An object returned by
rri_pipeline_st.- id
A data frame of experimental identifiers (same rows as
res$row_scores), containing at minimumtime_coland the columns ingroup_cols.- rec
Optional data frame from
rri_recovery_metrics. If supplied, trajectory class annotations are added to the right margin.- time_col
Character. Name of the time column in
id.- group_cols
Character vector. Columns in
iddefining trajectory groups (e.g.,c("plot", "depth", "plant_id")).- perturb_start
Numeric. Start of perturbation phase (same units as
time_col).- perturb_end
Numeric. End of perturbation phase.
- palette
Character. Viridis palette option for RRI fill.
- base_size
Numeric. Base font size.
- max_groups
Integer. Maximum number of trajectory groups to display. The first groups in sorted label order are displayed when the total exceeds this value; the displayed fraction is reported. No random sampling occurs.
- order_by
Order trajectories by mean RRI (default) or sorted keys.
- direction
Viridis colour direction, either 1 or -1.
- tile_gap
Fraction of each sampling cell left as a gap, in [0, 1).
- event_colour
Colour of event boundary lines.
Details
Tile width is 90 percent of the smallest distinct observed time
spacing. This prevents tiles implying continuous observation across long gaps.
Explicit missing scores are grey with a cross; unsampled times remain blank.
Event boundaries are shown at the exact supplied times. Scores must be in
[0, 1] or missing. Identifier keys are aligned when supplied in row_scores;
scores-only output must retain input row order. Duplicate group-time keys
and ambiguous recovery annotations are rejected.
Examples
sim <- simulate_redox_holobiont(
  n_plot = 2, n_depth = 2, n_plant = 3, n_time = 14,
  p_micro = 20, seed = 101
)

res <- rri_pipeline_st(
  ROS_flux     = sim$ROS_flux,
  Eh_stability = sim$Eh_stability,
  micro_data   = sim$micro_data,
  id           = sim$id,
  reducer      = "per_domain",
  scaling      = "pnorm"
)
#> Warning: Unanchored latent axes have arbitrary signs; RRI is exploratory, not directionally validated resilience.
#> Warning: Excluding simulator-derived hidden columns from scoring: Cacc_EAC, Cacc_EDC, Cacc_total, Cacc_fraction, net_oxidative_balance, alpha_accept, alpha_donate, k_accept_h, k_donate_h

rec <- rri_recovery_metrics(
  res           = res,
  id            = sim$id,
  time_col      = "time",
  group_cols    = c("plot", "depth", "plant_id"),
  perturb_start = 5,
  perturb_end   = 8
)

plot_rri_recovery_map(
  res           = res,
  id            = sim$id,
  rec           = rec,
  time_col      = "time",
  group_cols    = c("plot", "depth", "plant_id"),
  perturb_start = 5,
  perturb_end   = 8
)