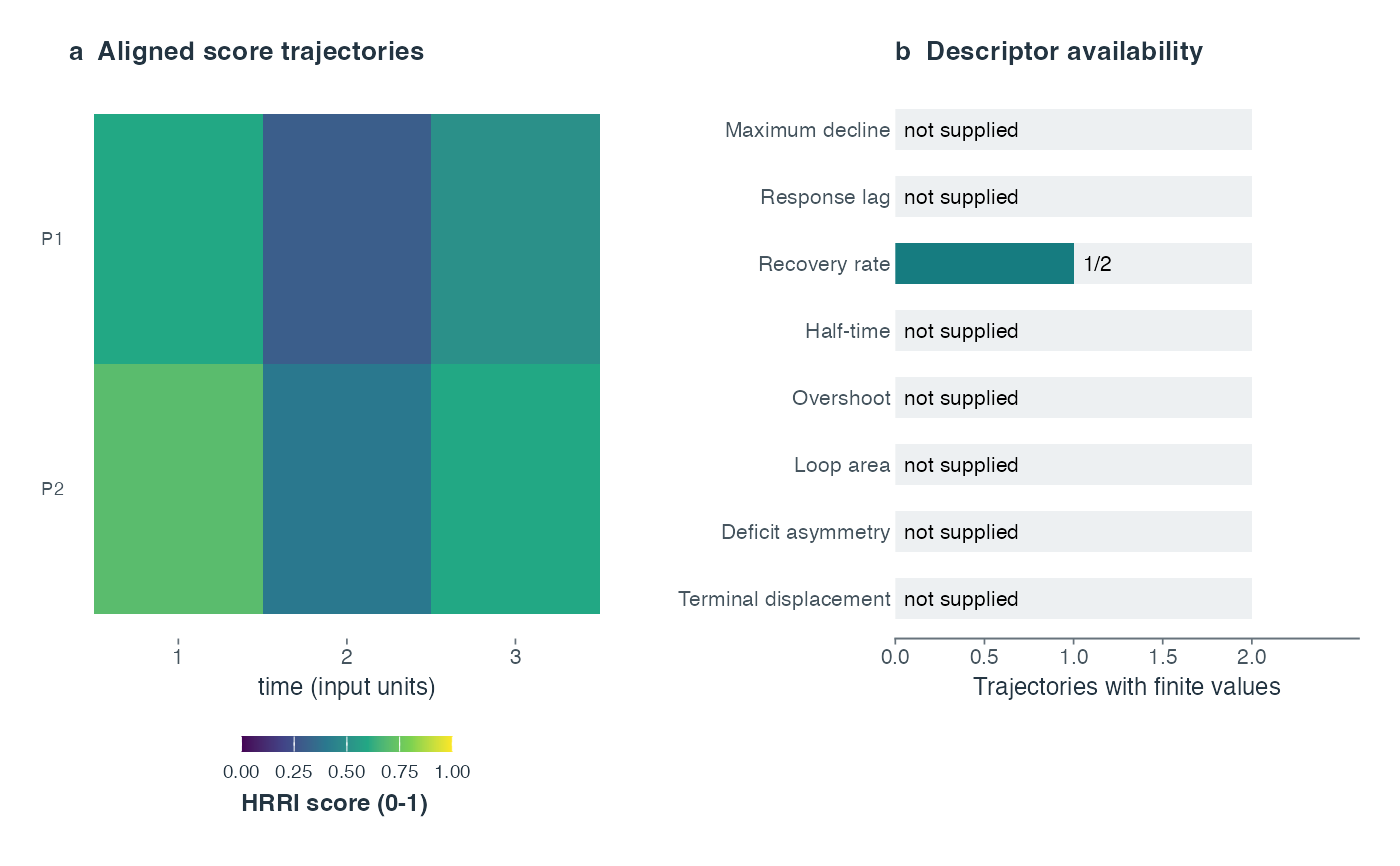
Aligned score trajectories and recovery-descriptor availability
Source:R/plot_rri_recovery_diagnostics.R
plot_rri_recovery_diagnostics.RdA two-panel display separating score dynamics from finite-output counts. A finite result is computational availability, not evidence of ecological validity, adequate precision or successful return to baseline.
Usage
plot_rri_recovery_diagnostics(
  res,
  id,
  rec,
  time_col = "time",
  group_cols = c("plot", "depth", "plant_id"),
  perturb_start = NULL,
  perturb_end = NULL,
  base_size = 9
)
Arguments
- res, id
Pipeline scores and their observation identifiers.
- rec
Recovery table with one row per trajectory in id.
- time_col
Name of the numeric time column.
- group_cols
Columns identifying trajectories in both id and rec.
- perturb_start, perturb_end
Optional exact event endpoints.
- base_size
Base font size in points.
Value
A patchwork object, or a named list of ggplots without patchwork. Export at approximately 8 by 4.6 inches.
Examples
id <- data.frame(plot = rep(c("P1", "P2"), each=3), time=rep(1:3,2))
res <- list(row_scores=data.frame(RRI=c(.6,.3,.5,.7,.4,.6)))
rec <- data.frame(plot=c("P1","P2"), k_recovery=c(.1,NA_real_))
plot_rri_recovery_diagnostics(res,id,rec,group_cols="plot")