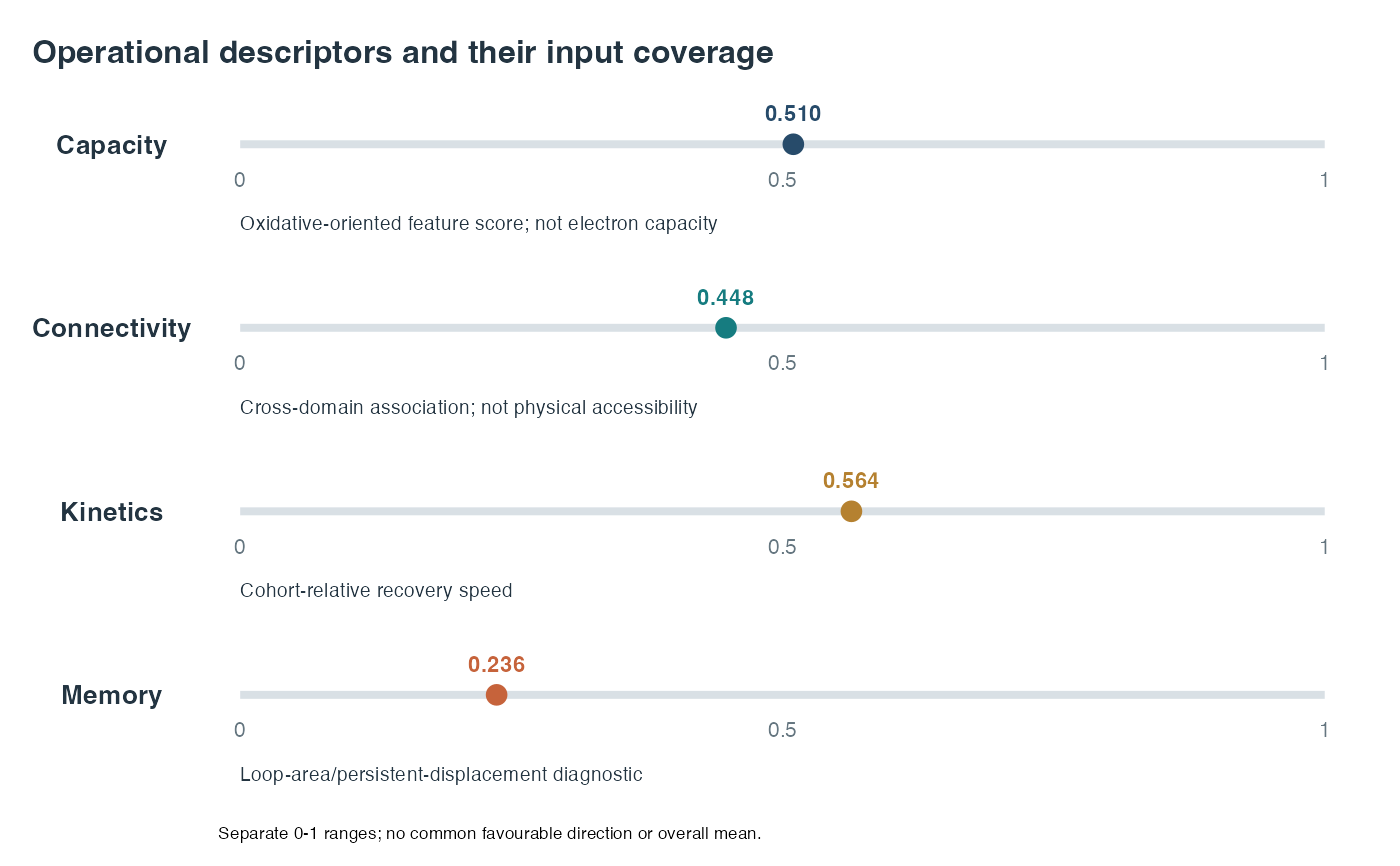
Displays available diagnostic summaries labelled Capacity, Connectivity,
Kinetics and Memory. The composite RRI is not an axis: it is built from
the plant, soil and microbial domains rather than from these four
properties, so averaging across it is not defensible. These axes are
operational descriptors returned by rri_property_scores;
they are not direct measurements or identified estimates of the theoretical
mechanisms bearing the same names.
Usage
plot_rri_properties(
  props,
  rri_value = NULL,
  group_list = NULL,
  fill_alpha = 0.2,
  colours = c("#1A3A5C", "#E07B39", "#2E7D32", "#7B3294", "#B2182B"),
  show_values = TRUE,
  title = "Operational descriptors and their input coverage",
  base_size = 10,
  type = c("profile", "radar"),
  rec = NULL,
  notes = NULL
)
Arguments
- props
A list returned by
rri_property_scores, or a named numeric vector with elementsCapacity,Connectivity,Kinetics,Memory(values in[0, 1]).- rri_value
Optional numeric. Composite RRI, reported in the subtitle for reference. It is not plotted as an axis and does not enter any average across property axes; no such average is calculated. Defaults to
props$rri_summaryif available.- group_list
Optional named list of property score vectors, one per group (e.g., per thaw stage or treatment). If supplied, multiple groups are displayed in separate panels.
- fill_alpha
Numeric in
[0, 1]. Polygon fill transparency.- colours
Character vector of polygon outline/fill colours, recycled across groups.
- show_values
Logical. Annotate each axis tip with the numeric score.
- title
Character. Plot title.
- base_size
Numeric. Base font size.
- type
Display type: separate-axis dot profile (default), or an explicit radar display for compatibility. Radar area is not a quantitative summary.
- rec
Optional recovery table for data-derived coverage notes; use only the same recovery table used to calculate props. With multiple groups supply explicit notes instead.
- notes
Optional named character vector (one note per property), or a named list of such vectors matching group_list. Describes score provenance.
Details
The default profile displays each descriptor separately, without an overall
mean or a common favourable direction. Missing values are labelled explicitly.
Out-of-range finite scores and infinite values are rejected, not clipped.
The optional radar chart uses Cartesian coordinates constructed with ggplot2; no
external radar-chart package is required. Each available axis runs from 0
(centre) to 1 (rim). Polygon area has no quantitative meaning, and axes based
on different transformations are not necessarily commensurable.
Axis meanings:
Capacity — oxidative-oriented soil feature composite; not accessible capacity unless the caller calculates and supplies it explicitly.
Connectivity — association or network-topology descriptor; not demonstrated electron transfer.
Kinetics — cohort- or timescale-relative recovery-speed descriptor; not a mineral exchange rate.
Memory — loop-area and persistent-displacement descriptor; not an identified causal memory state.
Examples
sim <- simulate_redox_holobiont(
  n_plot = 3, n_depth = 2, n_plant = 3, n_time = 14,
  p_micro = 30, seed = 99
)

res <- rri_pipeline_st(
  ROS_flux     = sim$ROS_flux,
  Eh_stability = sim$Eh_stability,
  micro_data   = sim$micro_data,
  id           = sim$id,
  reducer      = "per_domain",
  scaling      = "pnorm"
)
#> Warning: Unanchored latent axes have arbitrary signs; RRI is exploratory, not directionally validated resilience.
#> Warning: Excluding simulator-derived hidden columns from scoring: Cacc_EAC, Cacc_EDC, Cacc_total, Cacc_fraction, net_oxidative_balance, alpha_accept, alpha_donate, k_accept_h, k_donate_h

rec <- rri_recovery_metrics(
  res           = res,
  id            = sim$id,
  time_col      = "time",
  group_cols    = c("plot", "depth", "plant_id"),
  perturb_start = 5,
  perturb_end   = 8
)

props <- rri_property_scores(
  res       = res,
  rec       = rec,
  soil_df   = sim$Eh_stability,
  eac_col   = "EAC",
  edc_col   = "EDC",
  humic_col = "dissolved_organic_matter_redox"
)

plot_rri_properties(props)