Identifiability, sensitivity and oxygen-accounting illustrations
Source:R/plot_rri_identifiability.R
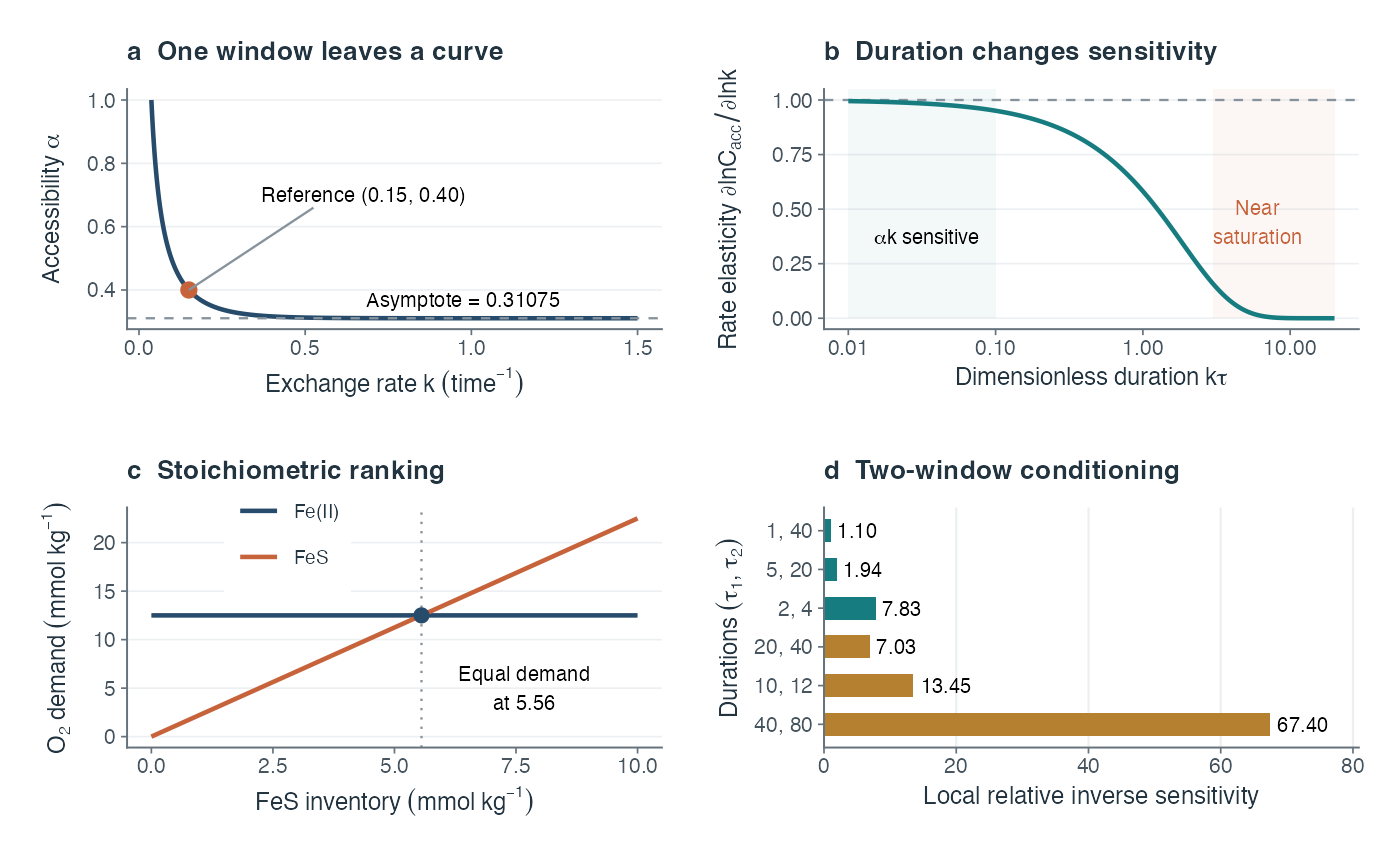
plot_rri_identifiability.RdFour analytical panels for a single declared reservoir. They demonstrate non-identifiability from one observation window and local conditioning of two-window inversion; they do not estimate parameters from HRRI scores.
Arguments
- Q
Positive inventory, in electron-equivalent units.
- alpha
Accessibility in (0, 1).
- k, tau
Positive reference rate and duration in reciprocal units.
- duration_pairs
Two-column numeric matrix; each row contains positive increasing observation durations.
- fe_inventory
Positive Fe(II) inventory in mmol per kg.
- base_size
Base font size in points.
Value
A patchwork object, or a named list of ggplots if patchwork is absent. Export at approximately 7.4 by 6.4 inches.
Details
The illustration uses C = Q alpha (1 - exp(-k tau)). Rate elasticity is k tau / expm1(k tau). Two-window sensitivity is the reciprocal absolute difference of those elasticities, not a confidence interval. Oxygen demand uses 0.25 mol O2 per mol Fe(II), and 2.25 mol O2 per mol FeS, for oxidation to Fe(III) and sulfate. These specified endpoints are essential.